Dashboard
The dashboard is the first page you see after signing in. It gives firm users a live overview of requests, activity, and clients, plus shortcuts for creating almost anything. This guide walks through each part of the page.
Layout tour
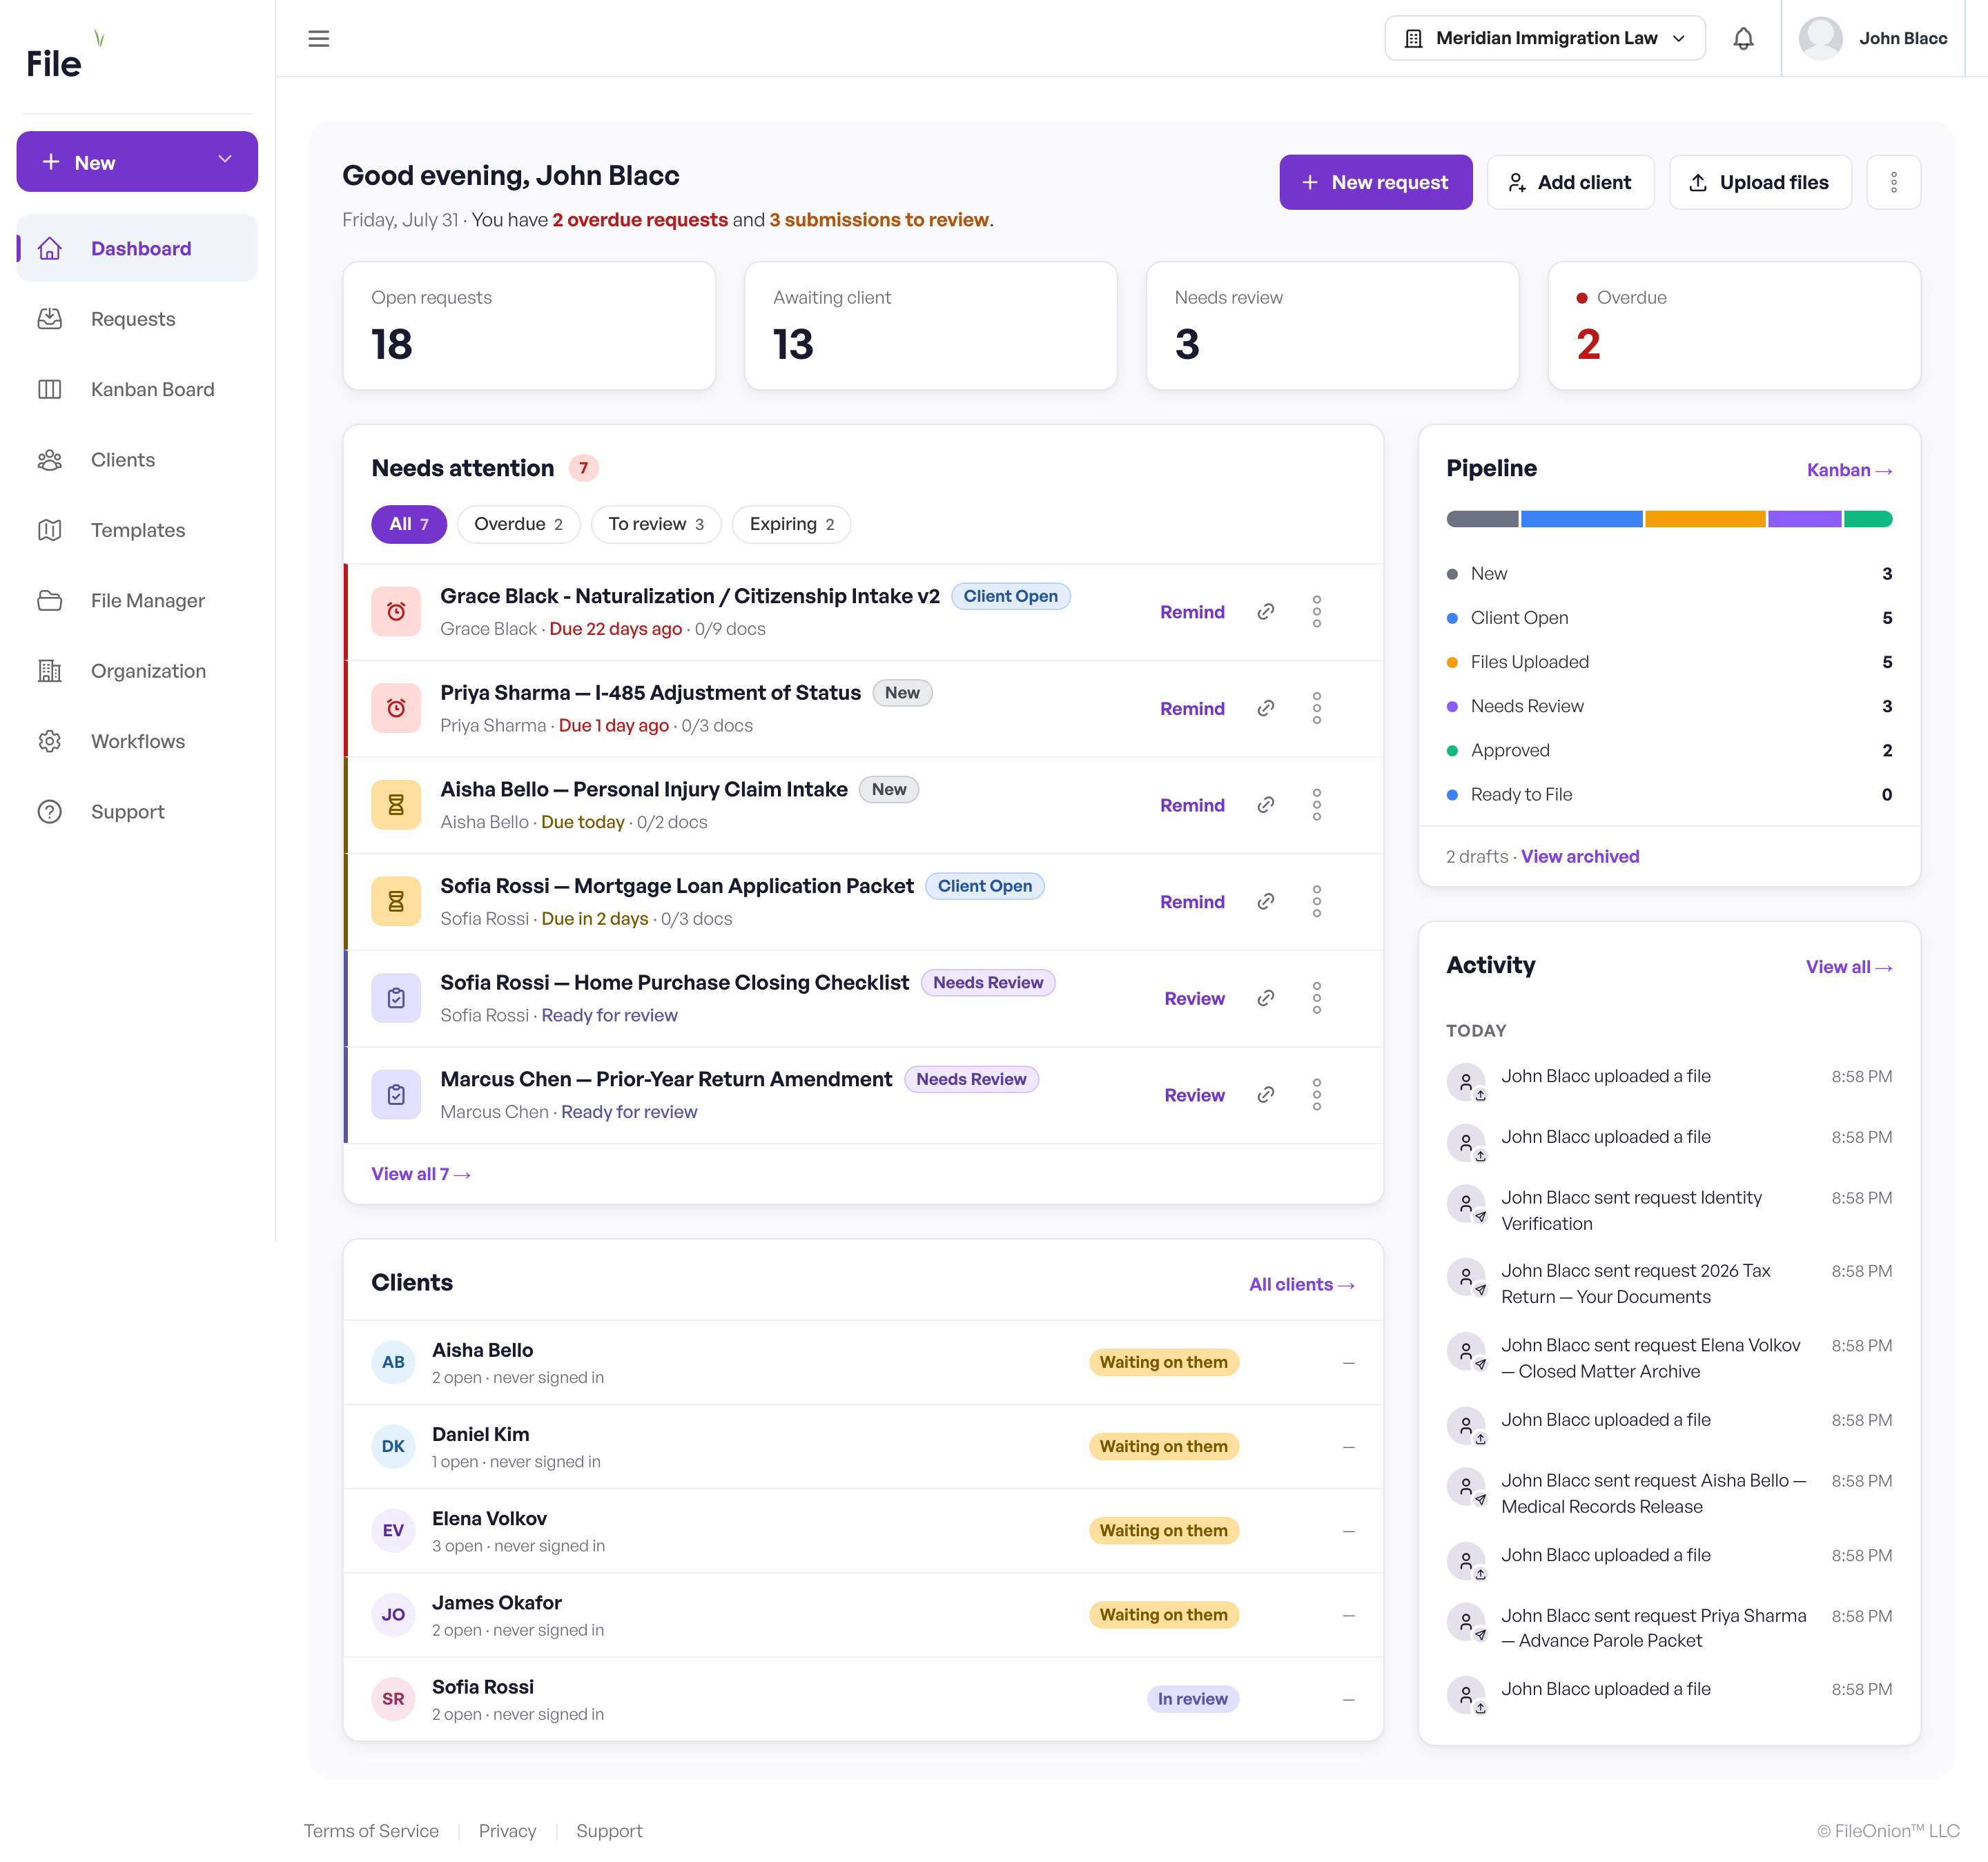
At the top, the dashboard greets you by name. The dashboard is attention-first: it answers "what needs me right now?" before it shows you totals.
If you're on a trial, a status banner sits above everything with your remaining days — see Plans & Billing.
- KPI strip — four tiles across the top: Open requests, Awaiting client, Needs review, and Overdue. Overdue turns red when it isn't zero. Click any tile to open the request list.
- Needs attention — the queue of requests that actually need action, filterable by All, Overdue, To review, Expiring, and Stale. Each row offers quick actions inline; on a phone the copy action folds into the row's ⋮ menu.
- Clients — your clients with a live status chip apiece (In review, Waiting on them, All caught up). See Clients.
- Pipeline — a proportional bar showing how your open requests are distributed across workflow stages, with a legend naming each segment. This is the summary view of your Kanban board.
- Activity — the latest actions across your firm (uploads, sends, approvals, and so on). Open the widget menu and choose View all activities for the full history.
Statuses are workflow stages
The status badge on each request is the name and color of the workflow stage it currently sits in, and the Pipeline bar mirrors the columns of your Kanban board. If your firm renames or adds stages, the dashboard reflects that automatically. See Workflows.
Creating things: the New menu
The purple New button at the top of the left sidebar is the quickest way to create anything:
- New request — opens the request composer. See Requests.
- New client — opens the add-client form. See Clients.
- New message — starts a message on a request.
- New template — creates a reusable request template. See Templates.
- File upload — uploads files to the File Manager. See File Manager.
- Create folder — adds a folder in the File Manager.
On a phone or tablet, the centered + button in the bottom navigation opens the same Create new… options. See FileOnion on mobile.
Notifications
The bell icon in the header carries a live unread count — it updates without a refresh as things happen. Click it to open your notifications (on mobile it opens as a bottom sheet):
- Rows are grouped by day (Today, Yesterday, …) and filterable with the All / Unread toggle.
- A row tells you who did what — a client uploaded a file (uploads in the same hour collapse into one row), commented, opened a request you sent, or submitted a document. You never get a notification for your own action.
- Click a row to jump straight to the request, Mark all read to clear the badge, or View all activity for the full history.
The bell is always on. The emails that accompany this activity are what you control under Settings → Notifications — see Settings & Preferences. Your clients have a bell in their portal too, where document approvals and declines land; see The Client Experience.
Profile menu
Click your avatar in the header to open the profile menu:
- Settings — your account preferences. See Settings & Preferences.
- Team — user management for your organization (Owners and Admins only). See Team Members & Roles.
- Billing — plan and payment management (Owners and Admins only). See Billing.
- Support — the in-app support center.
- Logout — signs you out.
If you belong to more than one organization, use the organization switcher in the header to move between them.
Getting to the Kanban board
The dashboard's Pipeline card summarizes your stages; to work them visually, open Kanban Board from the left sidebar and drag requests between stage columns. See Kanban.
Client accounts see a different home page
Users with the Client role get a simplified dashboard showing their recent requests (and shared documents, when enabled) instead of firm widgets. See Client Portal.